Full transcript of the keynote speech delivered at the 5th Asian Historical Economic Congress, Seoul National University, April 2-3, 2016
Numbers in brackets refer to PPT slides.
I want to begin by saying thanks to the organizers for inviting me as a keynote speaker. It is a great honor for me to speak to an audience of distinguished scholars from around the world. I was so carried away by the invitation that that I decided to talk about an important event I do not know very much about. The important event is the Korean growth miracle, which refers to per capita output growing nearly 7% per year for three decade after 1960 [#2]. The growth was more than three times as rapid as the world average and allowed Korea to narrow income gap vis-à-vis the developed world effectively [#3].
Growth accounting studies typically found that the miracle was driven primarily by capital accumulation, so I will begin by identifying the causes of the rapid growth in capital stock. I will then argue that the causes driving the physical capital accumulation, indicated by vector X, also propelled human capital accumulation [#4]. Human capital promotes technological learning, it therefore follows that X lay at the heart of the miracle. The vector X included pubic investment in schooling as the most important element, so I will conclude by explaining what led the Korean government to invest heavily in education [#5].
During the growth miracle, the aggregate output grew 9% per year, 4% points of which was accounted by the accumulation of physical capital, with the contribution from productivity advance being only half as large as that. [#6].
The rapid capital accumulation was associated with a huge investment boom, which was financed largely by domestic resources. The aggregate savings ratio quadrupled from 10% in 1960 to 40% in three decades later [#7]. The savings boom was driven primarily by the surge in household, rather than corporate or government savings [#8]
As Jeff Williamson asked almost four decades ago, why did Koreans save so little in 1960? And as Ken Kang, a student of Jeff’s, subsequently asked, why did Koreans save so much in 1990? Four explanations have been offered so far [#9]. One is that the savings was driven by income volatility associated with growth. This is precautionary savings story based on the permanent income hypothesis. The second explanation is based on the life cycle theory, saying that consumption, hence savings, does not depend on current income, but on life time wealth. Economic growth increases the lifetime wealth of young savers more rapidly than that of elderly dissavers. By aggregation, the differential impact of income growth on age specific lifetime wealth implies economic growth raises the saving ratio. The third explanation assumes consumption is constrained by habit, which implies consumption rising less rapidly than income, hence increase in the savings ratio. The final explanation is known as “demographic dividend story” and focuses on fertility transition. As fertility rate declined, the population share of dissaving dependents declined and that of working and saving age groups increased, which resulted in the rise in the aggregate savings ratio.
Growth and saving interact with each other, with savings promoting growth as in the neoclassical growth model and with growth encouraging savings as in the first three explanations of the Korean savings boom. As I will show shortly, there is little doubt about income growth encouraged savings in Korea from 1960-90, but the causation from growth to savings is not what I want to talk about today. Rather, my focus today is on what set off the investment-led growth in the first place. Therefore, the demographic dividend story is relevant and serves as a convenient starting point for the search of the secrets of the growth miracle, because it highlights fertility transition as an exogenous event driving the savings boom. So let’s begin by taking a closer look at this story.
During the saving boom, total fertility rate declined from about 6 to 1.5 — negative correlation, which has served as prima facie evidence for the demographic dividend story [#10]. Correlation however is not causation. It is important to note that fertility is an endogenously determined. Fertility depends on living standards, and in Oded Galor’s unified growth theory fertility transition is driven by industrialization, gender wage gap, and skill premium, among others. In my view, the negative correlation represents the presence of confounding factors, because children and saving are two alternative ways of providing for old age. So, I take the following observation by Mark Gersovitz seriously: “if parents choose family size with a view to being supported in their old age, then family structure and savings are jointly determined. In this case, it would be inappropriate in econometric analysis to explain savings by demographic variables.” [#11]
Financial development is one such confounder. In traditional societies with rudimentary capital markets, peasants have little choice but to save through children for old age security, hence the saying that “children are poor man’s capital.” As the capital market develops, workers substitute bonds for children, which causes savings to increase on the one hand and fertility to decline on the other [#12]. Two distinct studies by Richard Steckel and Basso, Bodenhorn, and Cuberes showed evidence of the establishment of banks lowering fertility in the nineteenth century U.S.
Here is a piece of evidence of financial market development occurring during the South Korean growth miracle [#13]. Deposits as share of nominal GDP rose from 5% in 1960 to 35% in 1990, which represented for the most part recovery from the dislocation caused by post-colonial turmoil, including split into two regimes and the war they fought. This [#14] is the second piece of evidence of the financial development, which indicates narrowing interest rate gap between unregulated and regulated financial markets. Regulated market refers to the banking system, while moneylenders and pawnshops supplied credit in the unregulated markets. Note that a huge interest rate gap as large as 40% points prevailed in the 1960s, which narrowed to 10% points three decades later. This slide tells a story similar to that suggested by the preceding one. Note that the interest rate gap shrank in pre-1945 decades, widened with de-colonization, and then contraction resumed.
Two more confounding developments took place in the era of the Korean high growth, which included public investment in mass schooling and family planning policy [#15]. Suppose the access to schooling improves due to public investment. The shift will prompt parents to substitute child quality for quantity, reducing family size and possibly leaving them larger resources available for savings [#16].
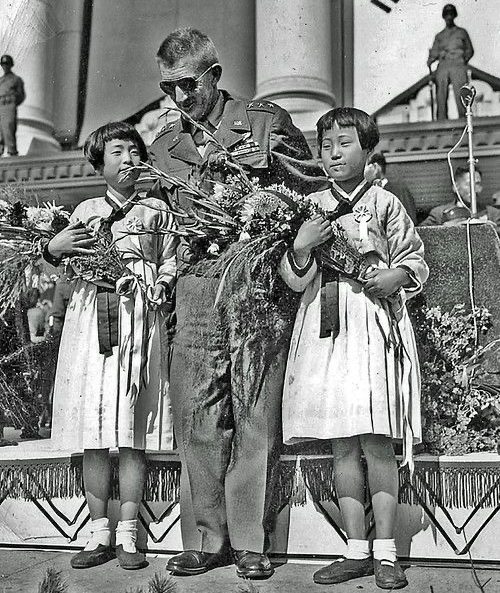
During the growth miracle, the South Korean government invested in secondary schooling, because primary school enrollment had virtually reached 100% by 1960 [#17]. Secondary school enrollment rate rose from roughly 20% in 1960 to 90% three decades later, which was driven by the expansion of public schools. The number of public schools increased far more rapidly than private schools [#18]. Although private schools accounted for roughly two fifths of all secondary schools, they in fact remained quasi-public, depending on public subsidy and being under public control in terms of tuition and admission. This picture shows how secondary schooling looked like in the 1970s [#19] I am not in this picture, but I can tell you that I used to look very much like one of these students.
Let me turn to the final confounder, the public campaign for birth control, which unfolded largely as free provision of family planning devices [#20]. The devices included two distinct types, one being disposable methods like condoms and pills and the other durable methods like intrauterine device, uterine tube operation, and vasectomy. The provision of fertility control technology would have helped parents to replace children with financial assets. In this poster, published by the Federation of South Korean Housewives in the 1970s, a popular cartoon figures holds a sign saying that population explosion is inevitable unless we act now [#21]. On the right-hand side of this picture, a smart looking female campaigner explains to peasants about whys and hows of family planning [#22]. Finally, this graph presents measures of the intensity of the policy to control population, which were derive by dividing, for instance, the number of condoms distributed with the number of persons aged 20-59.
I have just proposed a causal story, which remains yet to be tested. As the story goes, the fertility transition and savings boom were not causally related, but were outcomes of the three shock shown on the left hand side of this slide [#24] To see if this claim is supported by evidence, I ran two regressions using time series data spanning both colonial and South Korea. One is fertility equation, where the dependent variable is crude birth rate, and the other savings equation, having domestic savings rate as the dependent variable. On the right-hand side of the two equations are included 1) the interest rate gap between unregulated and regulated markets as a measure of financial undevelopment, 2) the number of secondary schools per area, a measure of supply of secondary schooling, and 3) two different measures of the intensity of birth control policy, corresponding to the two distinct methods of fertility control.
Here is the fertility equation estimated using time series data [#26]. Let me urge you first to concentrate on the yellow area. The coefficient estimates of the variables have expected signs and are statistically significant. The interest rate gap has a positive coefficient, but the coefficient estimates of the durable methods of fertility control and supply of secondary schooling are negative. The fertility consequence of the supply of primary schools was positive. Why? Separate estimation of fertility equation for colonial and South Korea using panel data indicated that the availability of primary schooling discouraged fertility before 1945, as secondary schooling did after 1960. The availability of primary schooling however boosted fertility only after 1960. The reason seems to be that with primary education having been made compulsory in 1950 and having become universal by 1960, limited access to primary schooling became a deterrent against child raising in South Korea
Here is the estimated savings equation [#27]. Both the availability of secondary schooling and the provision of durable methods of contraception promoted savings. But the provision of disposable methods of contraception discouraged saving. One interpretation of this result may be that that condoms and pill encouraged casual sex, which was positively associated with consumption. The coefficient estimate of financial development was insignificantly different from zero, presumably because financial development encouraged consumption by easing liquidity constraint, offsetting its positive impact on saving. Note that income growth is associated with a large and positive coefficient, which confirms the validity of the first three of existing explanations of the Korean savings boom.
Using the coefficient estimates, I calculated the contributions made by the public provision of secondary schooling birth control devices to find that schooling mattered far more than contraceptives. The intervention by the South Korean government to promote secondary schooling represented sharp break with the colonial past. Public spending for education rose from well below 0.5% under Japanese rule to 2.5% in 1960 [#28], which resulted in the surge in the number of public school teachers as share of public employment [#29] as well as the number of public schools per area [#30]. Why did the South Korean government give higher priority to education than its colonial counterpart?
Engerman and Sokoloff made an influential claim that the divergence between North and South America was caused by geographically determined inequality [#31]. Specifically, landed elites in Latin America blocked growth by delaying the advance of mass schooling. Supporting this claim, Go and Lindert found that the speed of the spread of mass schooling depended critically on the distribution of voting rights. Colonial Korea represented a sharply polarized society, with more than half of agricultural land being farmed under tenancy, on the eve of de-colonization. And there is evidence of landlords’ resisting higher taxation to finance mass schooling as in Latin America and the southern states of the U.S.
The end of Japanese rule caused sharp reduction in the land inequality for two reasons [#31]. One is that Japanese landowners fled leaving a large area of unclaimed land. And the other is that North Korea implemented land reform in early 1946 generating a strong demand for a similar reform in the south. Risks of land confiscation increased, leading landowners to sell off their holdings at bargain prices, and redistributing farmland in favor of small peasants. When the land reform law was introduced in 1948, traditional land tenancy had already been left in tatters.
The postcolonial land redistribution had two consequences [#32]. One is the downfall of traditional elite known as yangban. In 1910, Japan began its rule over Korea by implementing a comprehensive cadastral survey, acknowledging traditional property rights and choosing not to challenge either pre-colonial land inequality or status order. As a result, yangban hegemony over rural Korea persisted under Japanese rule, although traditional status order had been abolished by law as early as in 1894. The post-colonial land redistribution effectively abolished the institutional relic of dynastic Korea by destroying its economic basis. The second consequence is sharp reduction in income inequality as is indicated by the fall in Gini coefficient [#33]. In this graph, X-axis measures per capita output and Y-axis Gini coefficient. You see a Kuznets curve estimated with Gini’s observed in different parts of the world in different periods. Colonial and South Korean Gini’s are indicated by red squares and blue triangles. With de-colonization income inequality fell substantially as did living standards. There is also evidence of top 1% income share collapsing after 1945.
The reduction in social and economic inequality undoubtedly caused the surge in primary school enrollment in post-colonial years [#34]. The surge was driven by demand, rather than supply shock. In post-colonial years, the number of primary schools grew – following a trend, which looks like the extension of the colonial trend [#37], rather than sharp break from it. The demand explosion caused by the land redistribution eventually led the government to give higher priority to education.
Let me summarize summarizes what I have said so far with a diagram [#36]. First comes the post-colonial land redistribution, which caused the government to increase spending for education. This encouraged parents to make a shift from child quantity to quality, which speeded up human capital accumulation and set off fertility transition. By reducing family size, the fertility transition raised savings ratio, accelerating physical capital accumulation. Human capital speeds up technological learning, which together with physical capital accumulation resulted in the Korean growth miracle.
I have just proposed an unconventional interpretation of the Korean growth miracle, which was inspired by a longer run perspective than is typically taken by growth economists. In my view, my story has the advantage of being able to relate proximate to fundamental causes of growth. Two distinct schools of thought have highlighted different proximate cause of the high growth in South Korea, which are known as accumulationist and assimilationist [#37]. The accumulationist view, also labeled as fundamentalist, highlights the role of physical capital accumulation, which was made popular by Paul Krugman’s article published in the Foreign Affairs. In contrast, the assimilationist view, also known as absorptionist, is represented by Robert Lucas(1993)’s description of the growth miracle as being a “productivity miracle.” As I said at the beginning, growth accounting studies tend to support the accumulationist view, but in my interpretation of the growth miracle, the debate does not really matter, because technological advance depends on human capital accumulation, which was the other side of physical capital accumulation.
The debate overlaps considerably with that between market-driven and state-led views, because many, if not all, assimilationists focused on the contribution of industrial policy to technological learning [#38]. The hard evidence that we have at the moment however all points to damages done by market interventions [#39]. Compuable general equilibrium modelling indicated substantial deadweight. Cross sectional evidence shows negative effect of tariff protection on TFP growth. Finally, there is time series evidence of public spending slowing down improvement in living standards. Therefore, if the government did anything right to foster productivity advance, it was by expanding the supply of schooling.
Let me finish by discussing broader implications of my interpretation [#40]. There are two, one for comparative development in the post-WWII word and the other for the empirical validity of the life cycle theory of consumption and savings.
I think that my interpretation can help better explain why some developing countries grew faster than others in the post-WWII world. To demonstrate this, let me compare Taiwan and Thailand [#41]. Although the World Bank included the two countries as cases of the East Asian Growth Miracle, significant differences existed between the two. The two countries implemented land reforms, but land redistribution was not as comprehensive in Thailand as in Taiwan, which may have to do with regime, hence elite stability in Thailand. Thailand is the only East Asian country preserving independence against imperialist incursion, while Taiwan was occupied Japan in 1895 to be de-colonized half a century later. Living standards improved more rapidly in Taiwan than in Thailand, which was associated with more rapid fertility transition and spread of secondary schooling [#42]. Consistent with my story, Taiwan underwent an impressive savings boom comparable to that in South Korea, while the savings ratio at best stagnated in Thailand [#43].
Turning to the empirics of the life cycle theory of consumption and savings, let me first remind you what the theory predicts about the age-profile of savings ratio [#44]. Over the life cycle, incomes normally rise and then fall, but consumption does not change that much, which implies savings ratio rising from the negative territory to the positive and then falling back to the negative. This prediction has rarely been confirmed by data. In particular, Angus Deaton estimated age-specific savings ratio for Taiwan and found that the age profile had double, rather than single, humps [#45] in Taiwan, a result which has also been reported for Korea [#46] as well as Japan. A puzzle for the life cycle theory, this pattern makes sense, when child quality is taken into account as an element in parents’ wealth. The savings trough in the mid forties is matched by the peak in educational spending as share of total household expenditure [#47]. In my view, the life cycle model simplifies too much to be useful, and realistic models need to incorporate child quantity and quality as well as physical assets as components of portfolios households hold.
Thanks for being with me today. Here are two background papers you can download from my website [#48].
